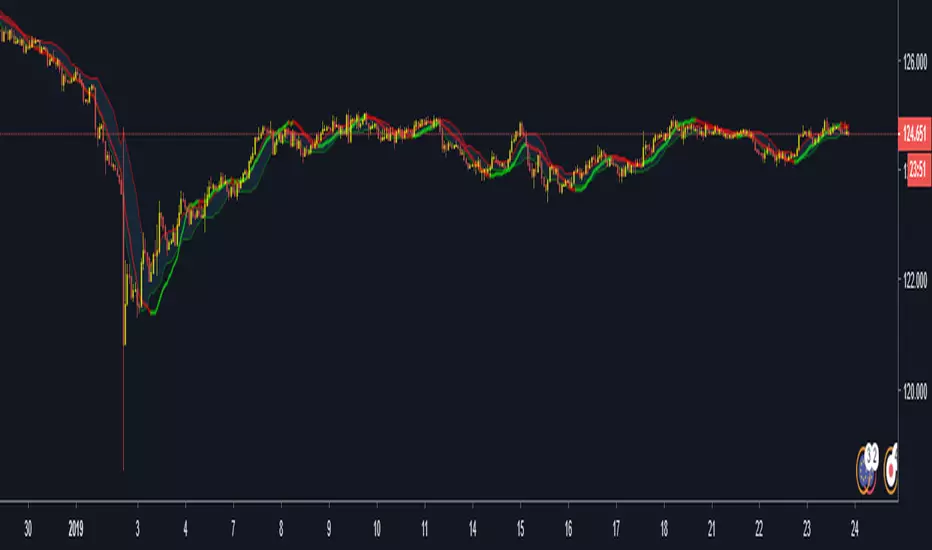
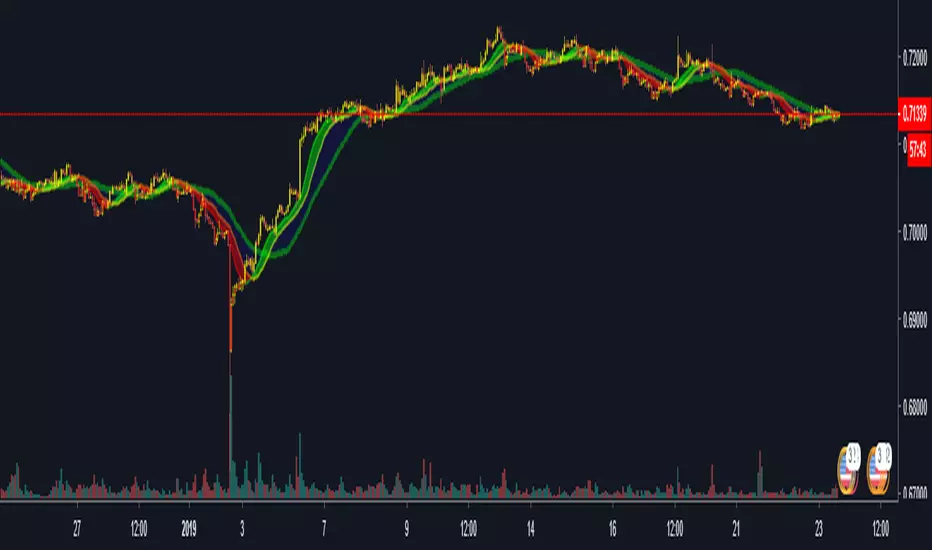
PpSignal Donchian Channels Gann HILO SmootheStrategy based on the growth of cfb and the middle donichian channel softened and ewo cross 0 signal.
- when cfb crosses up the middle donichian channel and ewo is up to 0 is buy
- when cfb crosses down the donichian middle channel and the ewo is below 0 , sell.
Attention: This strategy is recommended to be used in periods of volatility, see (). You can use btc, forex, futures, and penny stock.
[b]forex
PPSignal BB-EWO BB $ CFB Strategy ScalpThis indicator is an implementation of the Bollinger Band and EWO Oscillator and CFB Scalping system.
This technique is for those who want the most simple method that is very effective. It is BEST traded during the busiest trading hours, 3am to 12am EST NY time. This method doesn't work in sideways markets, only in volatile trending markets.
-Time Frames: 1, 5, 10, 15 ,30 min.
-Currency pairs: majors, btc , futures and volatile stock.
Other Chart indicators:
Add EWO bb.
Optionally Add Squeeze Indicato or bbsqueeze .
Here's the strategy:
// Going LONG:
Enter a long position when CFB has crossed up through the Bollinger upper band (lime) . At the same time, the EWO BB or BBqueeze should be approaching or crossing it's zeroline, going up. This is indicated by "Buy" alert.
// Going SHORT:
Enter a short position when CFB has crossed down through the low Bollinger red. At the same time, the EWO BB or BBqueeze should be approaching or crossing it's zero line, going down. This is indicated by the "Sell" Alert.
// Take profit:
// 10-20 pips depending on pair or When Awesome Oscillator turns a different color.
// HINTS: Best trades tend to occur when price reversing bounce off outer band and and outside Optional Bollinger Squeeze indication.
// References:
https://www.forexstrategiesresources.com...

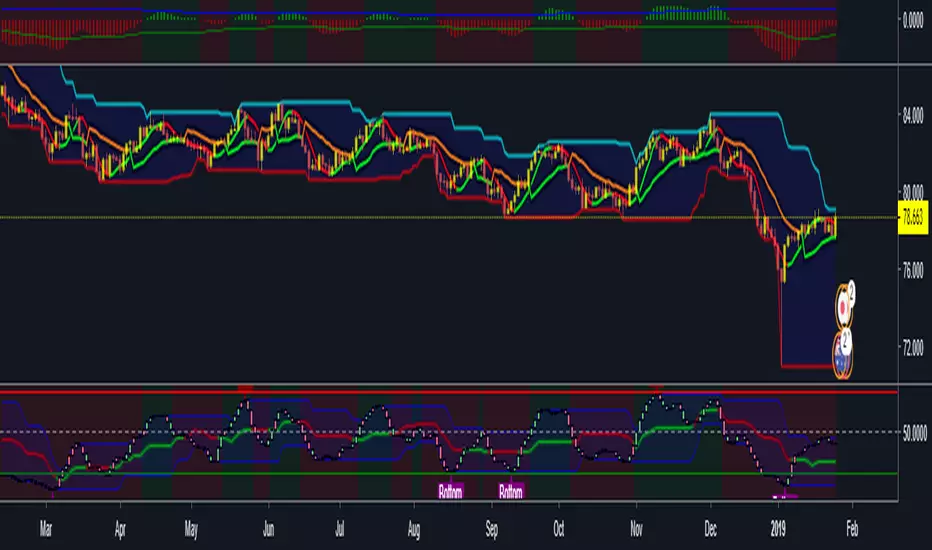
PPSignal BB and EWO BB Strategy ScalpDescription:
This indicator is an implementation of the Bollinger Band and EWO Oscillator Scalping system.
This technique is for those who want the most simple method that is very effective. It is BEST traded during the busiest trading hours, 3am to 12am EST NY time. This method doesn't work in sideways markets, only in volatile trending markets.
-Time Frames: 1, 5, 10, 15 ,30 min.
-Currency pairs: majors, btc, futures and volatile stock.
Other Chart indicators:
Add EWO bb.
Optionally Add Squeeze Indicato or bbsqueeze .
Here's the strategy:
// Going LONG:
Enter a long position when Curve Slope has crossed up through the Bollinger upper band (lime) . At the same time, the EWO BB or BBqueeze should be approaching or crossing it's zeroline, going up. This is indicated by "Buy" alert.
// Going SHORT:
Enter a short position when Curve Slope has crossed down through the low Bollinger red. At the same time, the EWO BB or BBqueeze should be approaching or crossing it's zero line, going down. This is indicated by the "Sell" Alert.
// Take profit:
// 10-20 pips depending on pair or When Awesome Oscillator turns a different color.
// HINTS: Best trades tend to occur when price reversing bounce off outer band and and outside Optional Bollinger Squeeze indication.
// References:
www.forexstrategiesresources.com

PpSignal Linear Regression SlopeThe slope indicator measures the rise-over-run of a linear regression, which is the line of best fit for a price series.

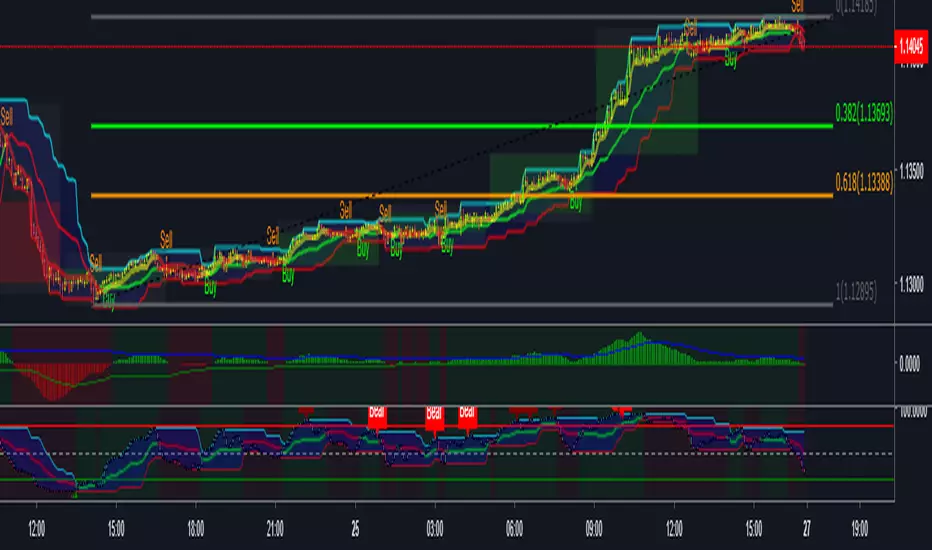
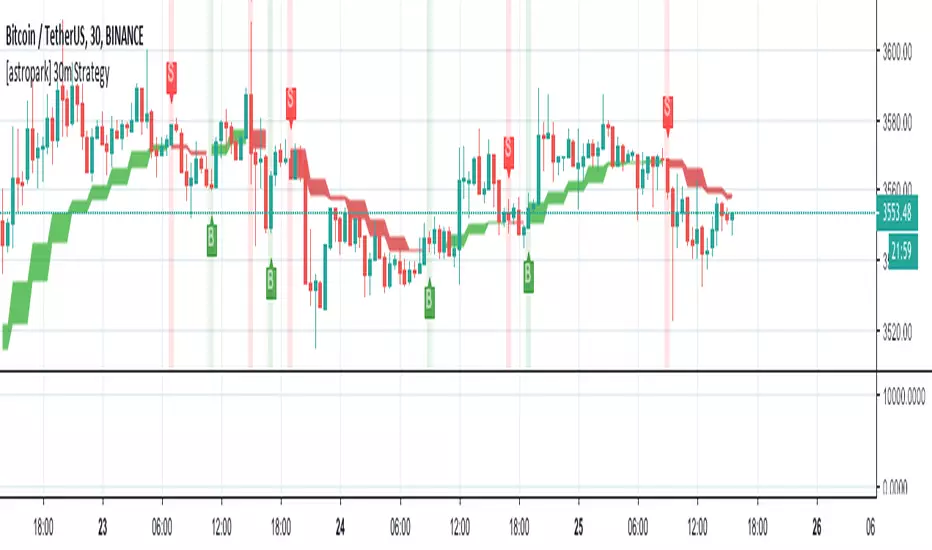
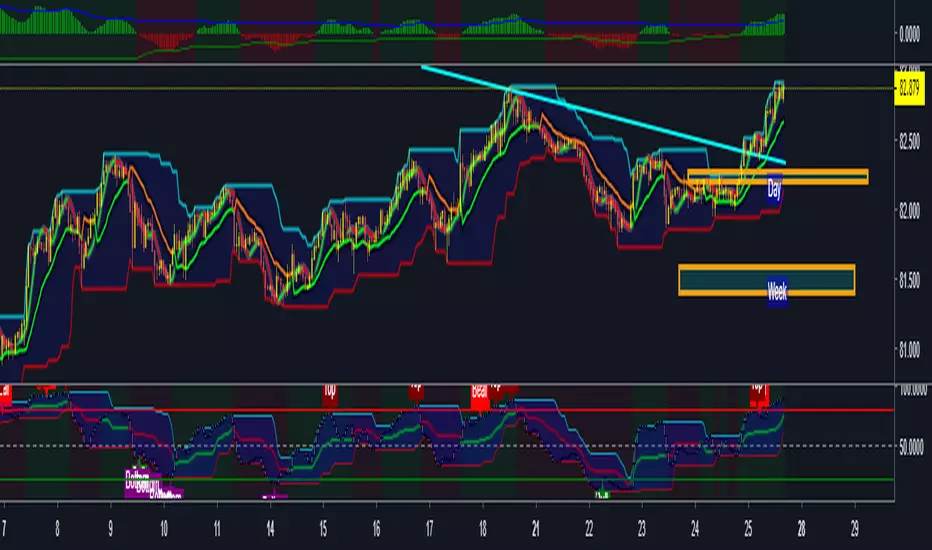
[astropark] Low TimeFrame Strategy (2H or lower)Buy/Long when you see a green "B" label on the screen "at best price you can", considering green cloud as support for more buys/longs
Sell/short when you see a red "S" label on the screen "at best price you can", considering red cloud as resistance for more shorts
BTC jar: 1K5kuYQPEqoNo6GRmJbHWMPmqwKM5S3oRR
ETH jar: 0x091b541a6dd6fe08c4e7bd909baafb2fce9b975e
LTC jar: LSVoAChsZrVsvbNyUfdpxtFpDAUSaUTUig
XRP jar: (XRP deposit tag) 103997763 (XRP deposit address) rEb8TK3gBgk5auZkwc6sHnwrGVJH8DuaLh

PpSignal Candle Converter V 1.0Yo can see 4h and day candle in superior time frame like a show in the picture. You can change the candle time frame too.
Enjoy.
PpSignal Donchian Channels Gann HILO SmootheThe traditional donchian channel with Gan Hilo smooth moving average.
PpSignal RSI Kaufman SMOOTHING Moving AverageSuper smoother Rsi Kaufman (ama) adaptive moving average.
PpSignal RSI Donchian Channels (Dynamic Zone Leo Zamansky)Rsi Donchian channel stoch based in teory of Dynamic Zone Leo Zamanky
PpSignal RSI MACD Adaptive Trima MA Just a simple MACD (Moving Aveage Convergence Divergence) indicator made of RSI, calc with TRIMA Moving Average, but this time with adaptive period for the moving averages.
As usual, you can play with settings to find your best parameters to your own trading style.
Converted from a MQL4 version to prorealtime, by a request in the Spanish forum.


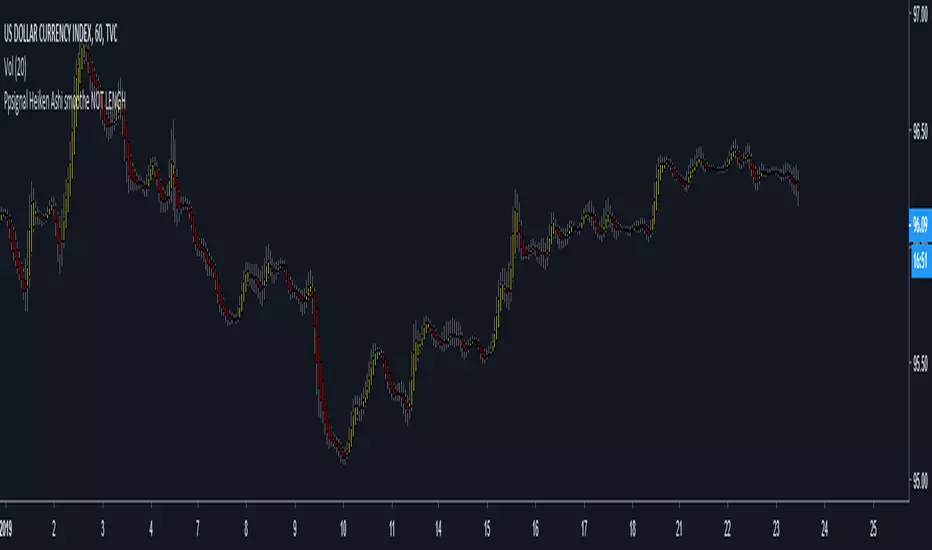
Ppsignal Heiken Ashi Candles Smoothe NOT LENGHHeiken ashi candles smoothed have no tongue shown the actual price smooth
PpSignal Haiken Hashi and Alma Super Smoother John Ehlers Buy or sell when alma and Haiken Ashi Change a Color.
PpSignal Price Channel ZonesAdded parameters for source of highest and lowest line. It's usefull for ultra volatile markets like cryptocurrencies, forex, futures and penny stocks. Using close price as source helps to filter out false breakout signals in turtle trading strategy.
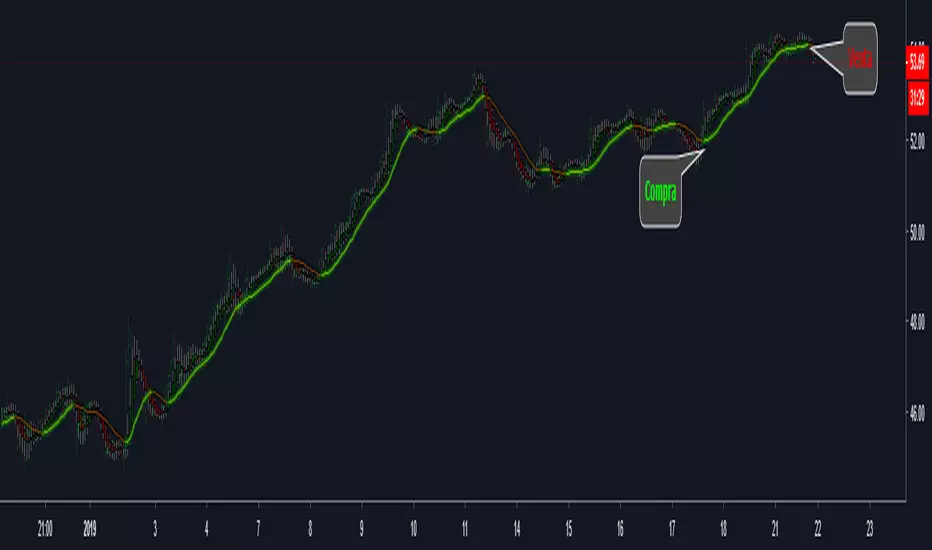
look the arrow...green buy and red sell

Ppsignal JURIK CrossoverIdeally, you would like a filtered signal to be both smooth and lag-free. Lag causes delays in your trades, and increasing lag in your indicators typically result in lower profits. In other words, late comers get what's left on the table after the feast has already begun.
That's why investors, banks and institutions worldwide ask for the Jurik Research Moving Average (JMA). You may apply it just as you would any other popular moving average. However, JMA's improved timing and smoothness will astound you.


